Table of contents
How to Choose an Anti-Aliasing Filter: A Six-Step Method
How to choose an anti-aliasing filter: set the attenuation target, pick Butterworth, Bessel or Chebyshev, size the order and topology, and design the ADC RC.
“What cutoff should my anti-aliasing filter have?” is the question, and “it depends” is the honest answer, which is why the question keeps coming back on every engineering forum. An anti-aliasing filter is the analog low-pass filter in front of an ADC that attenuates everything that would fold into your band after sampling. Choosing one is not one decision but six: how much attenuation you need and where, which response shape, what order, which circuit, what goes right at the ADC pin, and how much the component tolerances move the result. This guide takes them in that order, with the numbers that decide each one.
Key Takeaways
- Start from the attenuation you need at fs − fa, the first frequency that folds into a band of width fa. The cutoff frequency follows from that, not the other way round.
- Butterworth is the default: flattest passband. Choose Bessel when the shape of pulses and steps matters, and Chebyshev or elliptic only when the transition band is narrow and passband ripple is acceptable.
- Multiple-feedback (MFB) circuits are less sensitive to component variation than Sallen-Key; Sallen-Key at unity gain is simpler and has inherently accurate gain.
- A SAR ADC needs a small RC right at its input, with the capacitor at least about 20 times the ADC’s sampling capacitance, to absorb the charge kick at each conversion.
- Simulate the filter with real tolerances. A cutoff that moves by 10% across production can eat the margin you designed in.
The forum question and why “fs/2” is the wrong answer
The most common answer to “what cutoff should I use?” is “half the sample rate”. It sounds right, because half the sample rate is the Nyquist frequency. It’s wrong for two reasons. A filter with its corner at fs/2 attenuates only 3 dB at fs/2, so everything just above it folds back almost untouched. And the frequency that matters isn’t fs/2 at all; it’s fs − fa, the lowest frequency that lands inside your band of interest when it aliases.
The second common answer, “use an 8th-order elliptic”, over-corrects. It may meet the attenuation target, but it adds passband ripple, ringing and component sensitivity that a vibration or audio measurement may not tolerate.
The method below avoids both. It turns the question into numbers you can check: required attenuation at a specific frequency, an acceptable passband error, and an acceptable time-domain distortion.
Step 1: Set the attenuation target at the right frequency
Write down your band of interest (DC to fa), your sample rate fs, and the strongest signal or interference expected at and above fs − fa. Analog Devices’ tutorial MT-002 (Kester, 2008) frames the filter exactly this way: corner at fa, stopband beginning at fs − fa. The attenuation you need there is the difference between that interference level and the largest alias you can accept, usually your noise floor or half an LSB.
Worked example (illustrative): a 12-bit ADC on a 3.3 V range has 1 LSB ≈ 0.81 mV. If a 100 mV interference tone could sit at fs − fa, and the alias must stay below half an LSB (≈ 0.40 mV), you need 20·log₁₀(100 / 0.40) ≈ 48 dB at that frequency.
Common mistake: setting the target from a full-scale sine when the real out-of-band energy is much smaller, or the reverse. Measure or estimate the actual interference.
Step 2: Choose the response shape for your signal
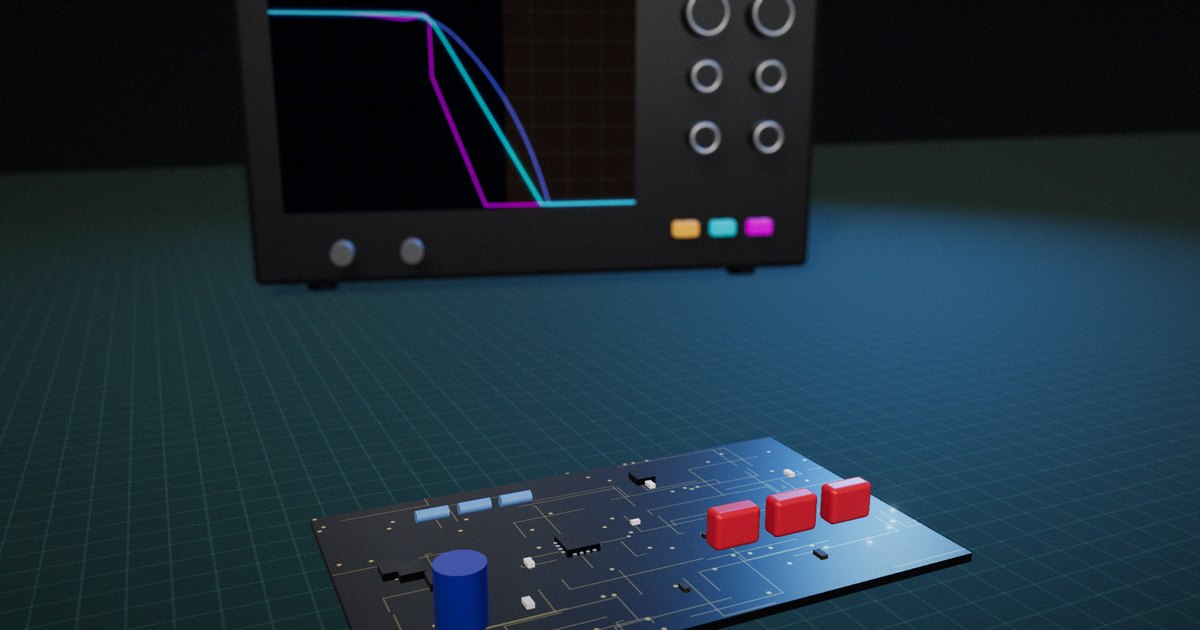
Texas Instruments’ application report Active Low-Pass Filter Design (Karki, SLOA049D, rev. 2023) compares the three common responses. Butterworth is optimized for a maximally flat passband and, in TI’s words, “can be considered to offer the best all-around filter response”, with some overshoot and ringing on steps. Bessel gives constant group delay and linear phase, so pulses keep their shape with no overshoot, at the cost of the slowest roll-off. Chebyshev rolls off fastest near the cutoff but allows passband ripple and rings the most.
The Bessel response goes back to W. E. Thomson’s 1949 paper in the Proceedings of the IEE on delay networks with maximally flat delay characteristics, which is why it’s also called the Bessel–Thomson filter. Its point is time-domain fidelity: every frequency in the passband is delayed by the same amount.
Choose by what the signal carries. Amplitude in a frequency band (vibration spectra, audio, power measurement): Butterworth. Shape in time (pulses, edges, step responses, multi-channel timing): Bessel. A narrow transition band where a little ripple is acceptable: Chebyshev or elliptic.
Common mistake: picking Chebyshev for steepness on a signal whose step response feeds a control loop or a threshold detector. The ringing becomes false events.
Step 3: Size the order from the attenuation target
For a Butterworth low-pass, attenuation at frequency f is 10·log₁₀(1 + (f/fc)²ⁿ) dB for n poles. MT-002 gives the rule of thumb behind it: about 6 dB per octave per pole. If the order comes out impractical, don’t add poles first; raise the sample rate, which pushes fs − fa away from the cutoff (see sampling, aliasing and filtering for a worked table). Bessel filters need more poles than Butterworth for the same attenuation because they roll off more slowly.
Continuing the example: band of interest 0 to 1 kHz, fc = 1 kHz, fs = 10 kSPS, so fs − fa = 9 kHz, a ratio of 9. A 2-pole Butterworth gives 10·log₁₀(1 + 9⁴) ≈ 38 dB; a 3-pole gives 10·log₁₀(1 + 9⁶) ≈ 57 dB. The 48 dB target needs three poles.
Common mistake: forgetting that a delta-sigma ADC’s digital filter changes the requirement. Its oversampling means the analog filter mainly needs to stop energy near the modulator frequency, which usually takes only a first- or second-order RC.
Step 4: Pick a circuit topology
TI’s SLOA049D compares the two common active topologies. Sallen-Key is non-inverting; at unity gain its gain accuracy is inherently good and the design simplifies, but its high-frequency rejection is limited by the op amp, because at high frequencies the signal can couple around the amplifier. Multiple-feedback (MFB) is inverting, generally less sensitive to component variation, and has better high-frequency behavior. In TI’s simulations, the two match at low frequencies and the MFB stays ahead at higher frequencies.
A 3-pole filter is commonly built as one 2-pole active stage plus one passive RC pole. The passive pole is often the RC at the ADC input from Step 5, which makes it do double duty.
Common mistake: choosing an op amp by DC precision alone. The filter amplifier needs enough gain-bandwidth for the filter’s Q and enough output drive for the ADC input.
Step 5: Design the RC at the ADC input
A SAR ADC samples by connecting an internal capacitor to the input. Each time it does, it pulls a burst of charge, and the driver has to recover before the sample is taken. Texas Instruments’ ADS7047 datasheet describes the standard fix: a small RC filter between the driver and the ADC input. The capacitor acts as a charge reservoir that refills the sampling capacitor quickly, and the RC also band-limits the driver’s noise. TI’s rule of thumb is a filter capacitor of at least 20 times the ADC’s sampling capacitance (for that device’s 16 pF input, more than 320 pF), using a C0G/NP0 capacitor for stability over voltage and temperature. The series resistor isolates the amplifier from the capacitive load; larger values improve stability but increase distortion, so TI recommends a SPICE check for more than 40° of phase margin.
Common mistake: putting a large-value X7R capacitor here. Its capacitance changes with voltage, which adds distortion to exactly the signal you’re trying to measure accurately.
Step 6: Check tolerances, then measure
Component tolerances move the corner frequency. Texas Instruments’ application note SBAA655A (Lee & Levin, 2024, rev. 2025) ran a 100-run Monte Carlo simulation on a 3rd-order anti-alias network: moving to 1% capacitors and 0.1% resistors tightened the spread of the cutoff by roughly a factor of three. Do the same for your design, then confirm on the bench by sweeping a sine through the band and above fs − fa.
Common mistake: verifying only the passband. Measure attenuation at fs − fa, where the filter earns its place.
Butterworth, Bessel or Chebyshev: a decision table
The table condenses Step 2 using the characteristics in TI’s SLOA049D.
| If your signal is… | Use | Why | Avoid | Because |
|---|---|---|---|---|
| A spectrum: vibration, audio, power quality | Butterworth | Flattest passband amplitude | Chebyshev | Passband ripple distorts amplitude |
| A shape in time: pulses, steps, edges | Bessel | Constant group delay, no overshoot | Chebyshev, high-order Butterworth | Ringing and overshoot look like events |
| Multi-channel with phase comparison | Bessel or matched Butterworth | Predictable, matched delay | Mixed filter types | Channel-to-channel phase error |
| Close to fs/2, sample rate can’t rise | Chebyshev or elliptic | Steepest transition | Bessel | Too slow a roll-off |
| Feeding a delta-sigma ADC | 1st- or 2nd-order RC | Digital filter does the rest | Steep active filter | Adds noise and cost without benefit |
Read down the “Avoid” column: most bad filter choices come from optimizing the frequency response when the signal’s information is in the time domain, or the reverse.
How to put it to work
If you have an hour
Write down fa, fs and the strongest interference at or above fs − fa. Calculate the attenuation you need there and check whether your current filter provides it, using the Butterworth formula or your filter tool.
If you have a sprint
Simulate the filter and ADC input RC with real tolerances (a Monte Carlo of 100 runs is enough to see the spread), then build it and measure attenuation at fs − fa and the step response. Record the generator amplitude, sample rate and part values next to the results.
If you want it to last the product’s lifetime
Keep the filter requirement (attenuation at a stated frequency, maximum passband error, maximum overshoot) in the design specification, not just the schematic values. When someone changes the sample rate or substitutes components, the requirement tells them what to recheck.
The question to ask yourself: “Can I name the frequency where my filter’s attenuation matters most, and the number it has to reach there?”
Frequently asked questions
What cutoff frequency should an anti-aliasing filter have?
Put the cutoff slightly above the highest frequency you need to measure, so in-band amplitude and phase error stay acceptable. Then check the attenuation at fs − fa, the first frequency that aliases into your band. If it’s insufficient, raise the sample rate or the filter order. Setting the cutoff at fs/2 gives only 3 dB of attenuation there.
Butterworth or Bessel for an anti-aliasing filter?
Butterworth when the information is in the amplitude spectrum (vibration, audio): it has the flattest passband. Bessel when the information is in the waveform’s shape or timing (pulses, steps): it has constant group delay and no overshoot, but rolls off more slowly, so it needs a higher order or higher sample rate for the same attenuation.
What order anti-aliasing filter do I need?
Calculate it: a Butterworth filter’s attenuation is 10·log₁₀(1 + (f/fc)²ⁿ) dB at frequency f for n poles, about 6 dB per octave per pole. Set f = fs − fa and solve for the attenuation target. If more than four to six poles are needed, raising the sample rate is usually cheaper.
Why does a SAR ADC need an RC filter at its input?
Each conversion connects the ADC’s sampling capacitor to the input, drawing a burst of charge. A small capacitor at the input, typically at least 20 times the sampling capacitance and of C0G type, supplies that charge, and a series resistor isolates the driver amplifier from the capacitive load. Together they also band-limit the driver’s noise.
Sallen-Key or multiple-feedback for an anti-aliasing filter?
Sallen-Key at unity gain is simple and has accurate gain, but its high-frequency rejection depends on the op amp. Multiple-feedback is generally less sensitive to component tolerances and rejects high frequencies better, at the cost of an inverting output and a less simple design.
Related reading: the full sensor signal chain and oversampling and decimation.
Sources
- Kester, W. (2008). “What the Nyquist Criterion Means to Your Sampled Data System Design.” Analog Devices Tutorial MT-002, Rev. A. https://www.analog.com/media/en/training-seminars/tutorials/MT-002.pdf
- Karki, J. (2000, rev. 2023). Active Low-Pass Filter Design. Texas Instruments Application Report SLOA049D. https://www.ti.com/lit/pdf/sloa049
- Thomson, W. E. (1949). “Delay Networks Having Maximally Flat Frequency Characteristics.” Proceedings of the IEE, Part III: Radio and Communication Engineering, 96(44), 487–490. https://doi.org/10.1049/pi-3.1949.0101
- Texas Instruments. ADS7047 datasheet (SBAS819), section “Application and Implementation”. https://www.ti.com/document-viewer/ADS7047/datasheet/application-and-implementation
- Lee, M., & Levin, M. (2024, rev. 2025). “Anti-Alias Filter Design for a 100kHz Bandwidth Data Acquisition Signal Chain.” Texas Instruments Application Note SBAA655A. https://www.ti.com/lit/pdf/sbaa655
- Shannon, C. E. (1949). “Communication in the Presence of Noise.” Proceedings of the IRE, 37(1), 10–21. https://doi.org/10.1109/JRPROC.1949.232969