Table of contents
Building an Ultrasound Echo Explainer: A Studio Note
Studio Note: we built an ultrasound echo explainer as a physics simulation. What we kept faithful, what we exaggerated and how it stays accessible to all.
Pulse-echo ultrasound is a good example of something that can’t be filmed. The pulse lasts microseconds, the wavelength is a fraction of a millimetre, and nothing about it is visible. An ultrasound echo explainer has to be built from the physics up, and the choices made along the way decide whether the viewer learns the right thing. This Studio Note describes how we built ours, a studio demonstration for our own site rather than client work, what we kept faithful, what we changed for legibility, and how we labelled the difference.
Key Takeaways
- The explainer is a small simulation, not a hand-drawn animation: the pulse’s position, the reflection and the transmitted wave are computed from speeds of sound and acoustic impedances.
- The numbers are textbook values: about 1540 m/s in soft tissue, about 4080 m/s in cortical bone, and impedances of about 1.63 and 7.8 MRayl, which give about 43% of the intensity reflected at the boundary and an echo at about 52 µs for a boundary 4 cm deep.
- Two things are exaggerated for legibility, wavelength and attenuation, and the frame carries the label “Wavelength and attenuation not to scale.”
- The relative speed in bone is kept faithful, so the transmitted pulse visibly speeds up and its wavelength stretches by the same ratio.
- Accessibility is built in: reduced-motion users see a still frame with the full trace and depth readout, captions describe each step, and a three-panel static version tells the same story.
What the explainer has to teach
The lesson is narrow on purpose: how an ultrasound system turns an echo’s return time into depth, and why a boundary between very different tissues produces a strong echo. Our articles on how ultrasound measures depth and acoustic impedance and reflection explain the physics in prose; the explainer has to make the same ideas visible:
- A short pulse travels at a known speed.
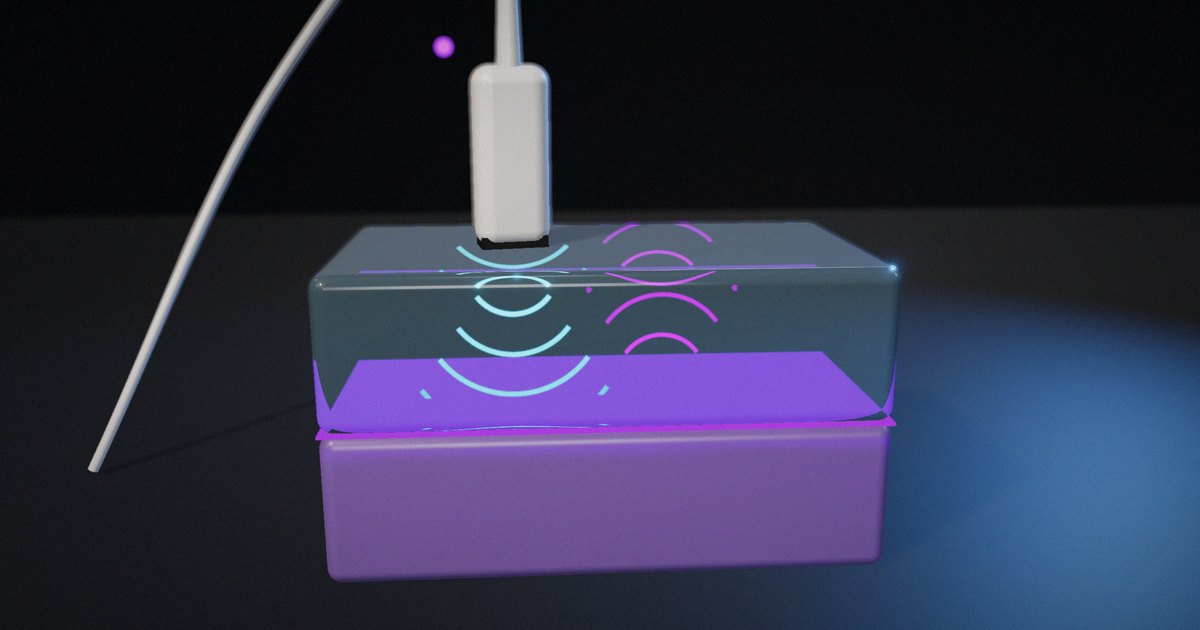
- At a boundary, part of the energy reflects and part continues, in proportions set by the acoustic impedances.
- The echo’s round-trip time gives the depth as d = c·t/2.
Tversky, Morrison and Bétrancourt’s review of animation (International Journal of Human-Computer Studies, 2002) argues that animation helps when the concept itself involves change over time and when viewers can perceive the change accurately. Pulse-echo timing is about change over time, so it’s a fair candidate. The second condition, accurate perception, is what most of the design work was about.
How we built it
1. Start from the physics, not the picture
We wrote the model first. Soft tissue is represented with the conventional average speed of about 1540 m/s; Wells’s review of ultrasonic imaging (Reports on Progress in Physics, 1999) describes how scanners assume a single speed of this order to convert time into depth. Cortical bone is represented with a textbook speed of about 4080 m/s. Acoustic impedances of about 1.63 MRayl for soft tissue and 7.8 MRayl for bone are within the ranges reported in tissue compilations such as Goss, Johnston and Dunn (Journal of the Acoustical Society of America, 1978) and Mast (Acoustics Research Letters Online, 2000); bone in particular varies widely.
From those values the model computes:
- The pressure reflection coefficient, (Z₂ − Z₁)/(Z₂ + Z₁) ≈ 0.65, and the fraction of intensity reflected, its square, about 43%.
- The round-trip time to a boundary 4 cm deep: 2 × 0.04 / 1540 ≈ 51.9 µs.
These are the numbers the captions quote. They assume normal incidence on a flat boundary, which is a simplification of real anatomy.
2. Slow time down, uniformly
The real echo arrives in about 52 µs. On screen, the pulse takes 1.7 seconds to reach the boundary, roughly 65,000 times slower than real time. Every motion uses the same time scale, so the relative timing is faithful: the pulse in bone moves faster than in tissue by the real ratio of the speeds, about 2.65 times.
3. Keep the wavelength change faithful, exaggerate the wavelength itself
A real diagnostic wavelength in tissue is a fraction of a millimetre; at the scale of a 4 cm path it would be invisible. The drawn pulse uses a much longer wavelength, about two cycles long, so the viewer can see it as a wave. When it crosses into bone, its wavelength stretches by the ratio of the speeds, because frequency stays the same and wavelength equals speed divided by frequency. That change is part of the lesson, so its proportion is kept.
4. Exaggerate attenuation, and say so
Real attenuation in tissue over a few centimetres would make a weak echo hard to see. The model includes attenuation along the path and a Gaussian spread of the beam, with the attenuation exaggerated for visibility. The frame carries the label “Wavelength and attenuation not to scale,” so the viewer knows which parts are faithful and which aren’t.
5. Record the echo on an A-scan
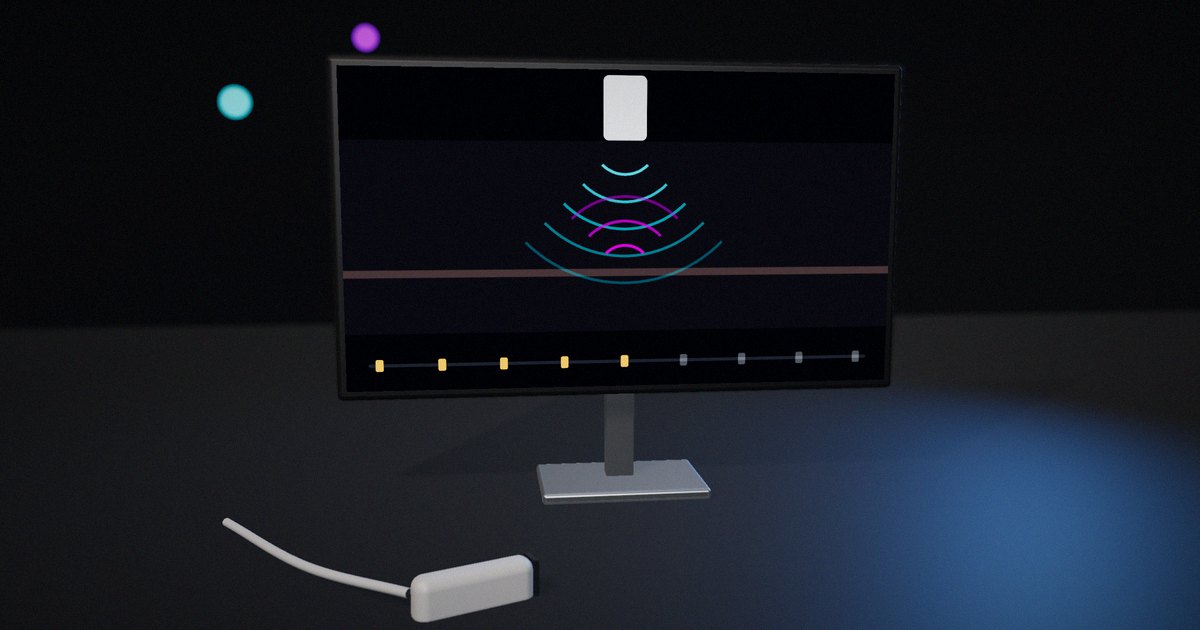
Below the beam, an A-scan trace records the received signal against time. The echo appears as a spike at the moment it returns, and the final caption gives the depth calculation: echo at about 52 µs, so depth = c·t/2 ≈ 4.0 cm. Linking the moving pulse to the trace is what turns the animation into an explanation of measurement rather than just a moving picture.
6. Narrate each step in words
A caption under the canvas changes with each phase: the transducer sends a short pulse; the pulse crosses soft tissue at about 1540 m/s; at the bone boundary about 43% of the energy reflects and the rest continues with a longer wavelength; the echo travels back; echo at 52 µs, so depth ≈ 4 cm. Mayer and Moreno’s review of ways to reduce cognitive load (Educational Psychologist, 2003) recommends synchronizing words with the matching visual and breaking a process into segments; the captions do both.
7. Design for reduced motion and static reading
If the viewer’s system asks for reduced motion, or they’ve paused motion on the page, the explainer shows a single still frame instead: the echo just returned, with the full A-scan and the depth readout. A separate three-panel version shows the same lesson as numbered stills, ending with “The echo’s return time gives the depth.” The main canvas has a text description for screen readers. The W3C’s WCAG 2.2 requires a way to pause moving content that starts automatically (success criterion 2.2.2); a still frame that carries the full explanation goes further, because the lesson doesn’t depend on the motion.
Faithful, exaggerated or simplified
| Element | Treatment | Why |
|---|---|---|
| Speed of sound in tissue and bone | Faithful (textbook values) | It’s the core of the depth calculation |
| Relative speed and wavelength change in bone | Faithful ratio | It’s part of what happens at the boundary |
| Fraction reflected | Faithful for normal incidence on a flat boundary | Shows why bone gives a bright echo |
| Time | Slowed uniformly, about 65,000× | Makes microseconds visible without distorting relative timing |
| Wavelength | Exaggerated, labelled | A real wavelength would be invisible at this scale |
| Attenuation | Exaggerated, labelled | Keeps the echo visible |
| Anatomy | Simplified to one flat boundary | Keeps the lesson to timing and reflection |
How to put it to work
If you have an hour
Pick one animation in your material and sort its elements into faithful, exaggerated and simplified. Check that every exaggeration is labelled on screen.
If you have a sprint
For your next explanatory animation of a physical process, write the model and the numbers first, compute what the animation will show, and only then design the visuals.
If you want it to last the product’s lifetime
Keep the model and its sources with the animation, so a reviewer can check the numbers and anyone updating it knows which parts are faithful.
The question to ask yourself: “Which parts of this animation are physics, and which are drawing, and can the viewer tell?”
Frequently asked questions
What does the ultrasound echo explainer show?
A short pulse leaving a transducer, crossing soft tissue, partly reflecting at a bone boundary and partly continuing, and the echo returning to be recorded on an A-scan, with the depth calculated from the echo’s return time.
Is the animation physically accurate?
The speeds, the reflection fraction, the relative timing and the change in wavelength at the boundary come from the physics. Wavelength and attenuation are exaggerated for visibility, and the frame says so. The anatomy is simplified to one flat boundary.
Why is about 43% of the energy reflected at bone?
Because the acoustic impedances differ a lot, about 1.63 MRayl for soft tissue and about 7.8 MRayl for bone. The intensity reflection coefficient at normal incidence is ((Z₂ − Z₁)/(Z₂ + Z₁))², which gives about 0.43.
How is depth calculated from the echo?
Depth equals the speed of sound times the round-trip time divided by two. With 1540 m/s and an echo at about 52 µs, the boundary is about 4 cm deep.
Is this client work?
No. It’s a studio demonstration built for our own site and labelled as such. Our client work in this area is the radiology-physics animation we produce for Sybil Digital Learning, where the educators provide the subject-matter expertise and review.
Related reading: how ultrasound measures depth, acoustic impedance and reflection and how we review technical animations for accuracy.
Sources
- Wells, P. N. T. (1999). Ultrasonic imaging of the human body. Reports on Progress in Physics, 62(5), 671–722. https://doi.org/10.1088/0034-4885/62/5/201
- Goss, S. A., Johnston, R. L., & Dunn, F. (1978). Comprehensive compilation of empirical ultrasonic properties of mammalian tissues. Journal of the Acoustical Society of America, 64(2), 423–457. https://doi.org/10.1121/1.382016
- Mast, T. D. (2000). Empirical relationships between acoustic parameters in human soft tissues. Acoustics Research Letters Online, 1(2), 37–42. https://doi.org/10.1121/1.1336896
- Tversky, B., Morrison, J. B., & Bétrancourt, M. (2002). Animation: can it facilitate? International Journal of Human-Computer Studies, 57(4), 247–262. https://doi.org/10.1006/ijhc.2002.1017
- Mayer, R. E., & Moreno, R. (2003). Nine ways to reduce cognitive load in multimedia learning. Educational Psychologist, 38(1), 43–52. https://doi.org/10.1207/S15326985EP3801_6
- W3C (2023). Web Content Accessibility Guidelines (WCAG) 2.2. W3C Recommendation. https://www.w3.org/TR/WCAG22/