Table of contents
How to Measure Microcontroller Power Consumption Properly
How to measure microcontroller power consumption: dynamic range, burden voltage, sampling rate, isolating the rail and turning current into battery life.
The datasheet says 1.5 µA in sleep. The multimeter on the bench says 180 µA. The battery estimate in the product plan assumed the first number, and the prototype is going to last weeks instead of years. Neither number is wrong; they’re measuring different things. To measure microcontroller power consumption in a way that predicts battery life, you need to capture currents that span four or five orders of magnitude, change in microseconds and come from more than the microcontroller. This guide walks through the steps, with the instrumentation research and benchmark methods that show where the usual measurements go wrong.
Key Takeaways
- Low-power devices span a huge range: one sensor-node study measured currents from about 1 µA to 30 mA, and another notes microcontroller power states spanning five orders of magnitude.
- A shunt resistor large enough to resolve microamps drops too much voltage at milliamps. That burden voltage lowers the supply and biases the result.
- Short wake-ups often dominate. In the example below, 5 ms of activity per second costs twenty times more charge than the remaining 995 ms of sleep.
- Measure only the microcontroller’s rail, with the debugger disconnected; debug probes, LEDs, regulators and pull-ups can add more current than the chip.
- Benchmarks such as EEMBC’s ULPMark-CoreProfile measure a full sleep–wake cycle because that, not the datasheet’s sleep figure, is what drains batteries.
The problem: the number on the datasheet isn’t the number in the product
Datasheet sleep currents are measured on the bare chip, at a stated voltage and temperature, with every peripheral off and pins configured to avoid leakage. A prototype has a regulator with its own quiescent current, a sensor that never sleeps, a floating input pin, an LED and a debug probe still connected. And the average current of a duty-cycled device is dominated by how often and how long it wakes up, which the datasheet can’t know.
Measuring it correctly is harder than it looks because the current changes by orders of magnitude within milliseconds.
Step 1: Decide what you need to know
There are two different questions. Average current over a realistic operating cycle predicts battery life. Energy per event (one sensor reading, one inference, one radio transmission) tells you which part of the firmware to optimize. The second needs time-resolved measurement; the first can be done with an averaging instrument only if the averaging window covers many complete cycles.
Step 2: Choose an instrument for the dynamic range
Di Nisio and colleagues, in IEEE Transactions on Instrumentation and Measurement (2016), studied a wireless sensor node whose working current ran from about 1 µA to 30 mA, a range of 30,000 to 1. Rottleuthner, Schmidt and Wählisch, describing their in-situ measurement system for low-end IoT devices, note that microcontroller power states can span five orders of magnitude.
The core difficulty is the shunt resistor. Illustratively, a 1 Ω shunt drops 30 mV at 30 mA, which is acceptable, but only 1 µV at 1 µA, which is too small to measure well. A 10 Ω shunt resolves microamps better and drops 300 mV at 30 mA, which can brown out a 1.8 V or 3.3 V device. Di Nisio and colleagues found that a plain shunt underestimates consumption because its drop lowers the supply voltage, and that a conventional shunt amplifier missed the node’s power-down current by about two orders of magnitude. Their solution held the load at a constant voltage with a feedback amplifier, which allowed larger shunts. Commercial energy monitors and source-measure units solve the same problem with automatic range switching or feedback designs.
Practical options, in rough order of capability: a multimeter in averaging mode (only for steady states), a shunt with an oscillator or data-acquisition system (sees bursts, limited range), and a dedicated energy monitor or source-measure unit with automatic ranging (both range and speed).
Step 3: Sample fast enough to see the bursts
A microcontroller can wake, read a sensor and go back to sleep in a millisecond. If the instrument averages over 100 ms or samples slowly, it misses or smears those events. Di Nisio and colleagues acquired at 1 million samples per second over 100 s windows for their node measurements. You won’t always need that rate, but you need enough samples inside the shortest event to integrate its charge.
Step 4: Measure only the rail you care about
Power the microcontroller from the measurement instrument and nothing else. Remove or open jumpers to LEDs, sensors and regulators you don’t want in the number, or measure them on separate rails. Disconnect the debug probe: a connected probe can keep debug logic powered and can back-power the chip through its signal lines. The MLPerf Tiny benchmark’s energy setup goes as far as an isolating, level-shifting IO interface between the host and the device so that only core power is measured.
Then configure the firmware the way the product will run: unused pins set to a defined state, unused peripherals and clocks off, and the real sleep mode in use.
Step 5: Mark events and integrate
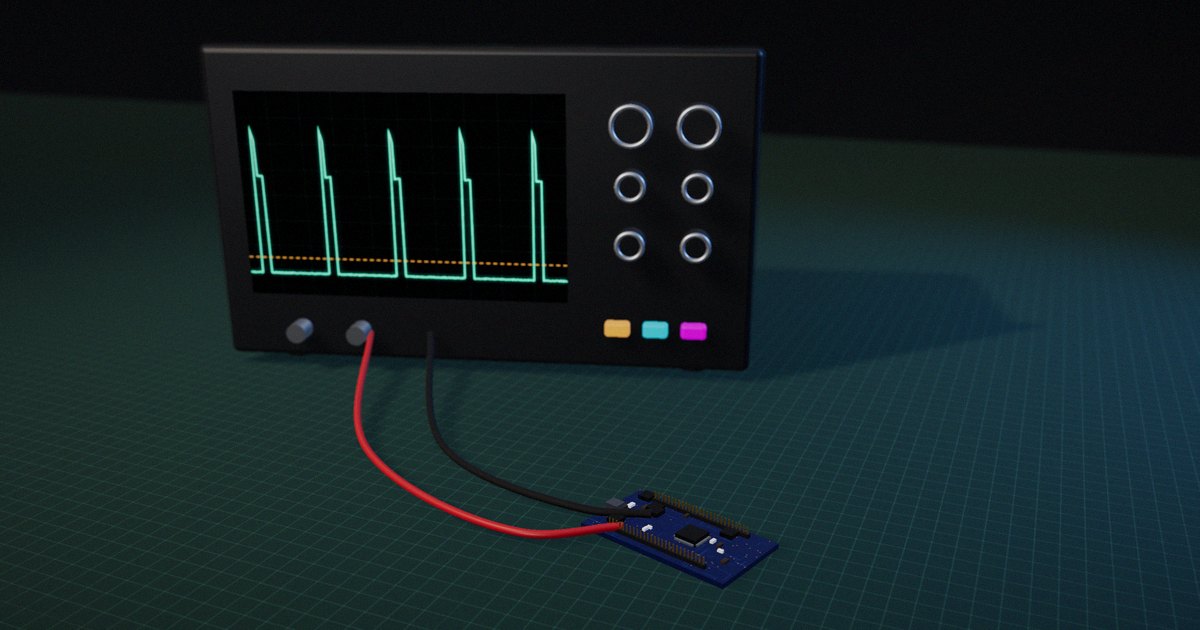
Toggle a GPIO pin at the start and end of each event you want to attribute (sensor read, radio transmission, inference) and capture it alongside the current trace. Integrate current over the marked window to get charge, and multiply by supply voltage for energy. Rottleuthner and colleagues built this kind of per-task attribution into the operating system itself, with trace start and stop calls, and reported median current errors of about 1% at 200 µA and 0.5% above 1.8 mA with a commodity shunt monitor.
Step 6: Turn the measurement into battery life
Average current is the sum of each state’s current times its fraction of time. An illustrative device sleeps at 2 µA, wakes once a second for 5 ms at 8 mA, and transmits once a minute for 20 ms at 15 mA:
- Wake-ups: 8 mA × 0.005 = 40 µA
- Transmissions: 15 mA × 0.020 / 60 = 5 µA
- Sleep: about 2 µA
- Total: about 47 µA
The 5 ms wake-up contributes twenty times the charge of the 995 ms of sleep. On a 620 mAh coin cell, 47 µA lasts about 13,200 hours, roughly 1.5 years, before derating for temperature, self-discharge and the battery’s behavior under pulsed loads. The most effective optimizations are usually fewer or shorter wake-ups, not a lower sleep current.
EEMBC’s ULPMark-CoreProfile benchmark is built on the same logic: it runs a one-second cycle in which the active portion is about 3% of the time, so sleep and the transitions into and out of it, including retaining RAM, dominate the score.
Step 7: Repeat across voltage and temperature
Sleep current in particular changes with temperature and supply voltage. Measure at the extremes the product will see, and at the battery voltage near end of life, before trusting the estimate.
Microcontroller power measurement methods compared
| Method | Dynamic range | Time resolution | Burden voltage | Good for | Misses |
|---|---|---|---|---|---|
| Multimeter, averaging mode | Moderate, manual ranges | Slow (averages) | Can be large on low ranges | Steady sleep current | Bursts; range changes |
| Shunt + oscilloscope or DAQ | Limited by shunt choice | Fast | Rises with shunt value | Event shapes and durations | Microamp sleep with a small shunt |
| Shunt + current-sense amplifier | Limited | Moderate to fast | Fixed by shunt | Active current | Very low currents (one study: off by ~100×) |
| Energy monitor or SMU with auto-ranging or feedback | Wide (µA to tens of mA and beyond) | Fast | Low | Full duty cycles, energy per event | Little, if the rail is isolated |
| In-situ monitor on the device | Moderate to wide | Moderate | Low to moderate | Long field measurements, per-task attribution | Very short events at low sample rates |
How to put it to work
If you have an hour
Disconnect the debugger, power only the MCU rail from your instrument and measure sleep current. Compare it with the datasheet figure; a large gap points to a leaking pin, peripheral or external part.
If you have a sprint
Capture a full operating cycle with an instrument that covers your range and samples fast enough, mark each event with a GPIO, and build a table of charge per event. Rank them and optimize the largest first.
If you want it to last the product’s lifetime
Add a power-cycle regression test that measures average current on every firmware release, at the product’s real duty cycle, and fails if it rises above budget. A one-line change that keeps a peripheral clock running can halve battery life.
The question to ask yourself: “Which single event in my duty cycle costs the most charge, and have I measured it on the bare rail with the debugger unplugged?”
Frequently asked questions
How do you measure a microcontroller’s sleep current?
Power only the microcontroller’s supply rail from an instrument that can resolve microamps without a large voltage drop, disconnect the debugger and other loads, configure pins and peripherals as the product will run, and wait for the reading to settle in the real sleep mode.
Why is my measured sleep current much higher than the datasheet?
Common causes are a connected debug probe, floating or misconfigured pins, peripherals or clocks left running, external parts such as regulators, sensors and LEDs on the same rail, and measuring in a lighter sleep mode than intended.
What is burden voltage in current measurement?
It’s the voltage dropped across the meter or shunt resistor that measures the current. It lowers the voltage reaching the device, which can change its behavior or cause a brownout at high currents, and it limits how large a shunt you can use to resolve small currents.
How fast do I need to sample current?
Fast enough to capture several samples inside the shortest event you want to measure. Wake-ups and radio bursts can last well under a millisecond, so tens to hundreds of kilosamples per second are common; one research setup sampled at 1 MS/s.
How do I estimate battery life from current measurements?
Multiply each operating state’s current by its fraction of time and sum them to get average current, then divide battery capacity by that average. Derate for temperature, self-discharge, end-of-life voltage and pulsed-load effects.
Related reading: how to measure an embedded AI demo, polling vs interrupts vs DMA and from development board to product.
Sources
- Di Nisio, A., Di Noia, T., Guarnieri Calò Carducci, C., & Spadavecchia, M. (2016). “High Dynamic Range Power Consumption Measurement in Microcontroller Based Applications.” IEEE Transactions on Instrumentation and Measurement, 65(9), 1968–1976. https://doi.org/10.1109/TIM.2016.2549818
- Rottleuthner, M., Schmidt, T. C., & Wählisch, M. (2019). “Eco: A Hardware-Software Co-Design for In Situ Power Measurement on Low-end IoT Systems.” arXiv:1909.10609. https://arxiv.org/abs/1909.10609
- EEMBC. “ULPMark-CoreProfile.” https://www.eembc.org/ulpmark/ulp-cp/
- Banbury, C., Reddi, V. J., Torelli, P., Holleman, J., et al. (2021). “MLPerf Tiny Benchmark.” Proceedings of the Neural Information Processing Systems Track on Datasets and Benchmarks. arXiv:2106.07597. https://arxiv.org/abs/2106.07597