Table of contents
How to Measure an Embedded AI Demo: Latency, Memory, Power
A step-by-step guide to measuring an embedded AI demo honestly: on-device accuracy, latency, memory and energy per inference, and how to report the conditions.
The demo video shows a board recognizing a gesture with a green LED and a caption that says “real-time, ultra-low power”. A customer’s engineer asks three questions: how accurate on the device, how many milliseconds per inference, and how many microjoules. Nobody has the numbers, or each number came from a different setup. If you want to measure an embedded AI demo in a way an engineer will trust, the four results (accuracy, latency, memory and energy) have to come from the same model, the same build and the same hardware, with the conditions written down. This guide gives the steps, borrowing the measurement rules of the MLPerf Tiny benchmark, which were written precisely to make these numbers comparable.
Key Takeaways
- Fix the task, dataset and minimum accuracy before measuring speed or energy; a faster model that misses the accuracy target isn’t a result.
- Measure accuracy on the device, through the device’s feature extraction, not in the training notebook.
- Measure latency over repeated runs and report the median, with the clock frequency. MLPerf Tiny runs at least 10 seconds and 10 inferences per run, five times.
- Measure energy on the core supply only, triggered by a GPIO edge, and report microjoules per inference.
- State whether feature extraction is included. MLPerf Tiny excludes it and notes that this can distort comparisons; a product demo usually shouldn’t.
The problem: four numbers from four different setups
Embedded AI claims tend to be assembled from pieces: the accuracy from the training run, the latency from a vendor’s benchmark of a similar model, the memory from the model file size and the power from the datasheet’s active current. Each piece may be true, and the combination still describes a system that doesn’t exist.
Banbury and colleagues wrote the MLPerf Tiny benchmark, with more than 50 organizations, because the field lacked a common way to measure these systems. Its rules are a good template for any demo, even one that will never be submitted to a benchmark.
Step 1: Define the task, the data and the accuracy target
Write down the task, the test dataset and the minimum acceptable accuracy before measuring anything else. MLPerf Tiny does this for each of its four tasks. For keyword spotting, for example, it uses the Speech Commands dataset with ten keywords plus “unknown” and “silence”, a reference depthwise-separable CNN of about 38,600 parameters (52.5 KB as a TensorFlow Lite model) and a quality target of 90% top-1 accuracy. A submission that doesn’t reach the target doesn’t count in its closed division.
For your demo, the target comes from the application: the false-alarm rate a user will tolerate, or the detection rate a maintenance team needs. Then every speed and energy number is reported only for a model that meets it.
Step 2: Measure accuracy on the device
Stream the test set to the board (over serial or USB), run the full on-device pipeline, including feature extraction from the raw input, and send back the outputs. Compare them with the labels on the host.
This catches the two most common silent failures: features computed differently on the device than in training, and accuracy lost in int8 quantization. MLPerf Tiny’s anomaly detection reference shows that quantization effects are real even in a well-run benchmark: the paper reports an AUC of 0.88 for the floating-point autoencoder and 0.86 for the quantized one.
Step 3: Measure latency with a hardware timer
Two methods work well. On Cortex-M cores that implement the Data Watchpoint and Trace unit’s cycle counter (DWT CYCCNT, defined in the Armv7-M architecture and absent on Armv6-M cores such as the Cortex-M0 and M0+), read the counter before and after inference. On any core, toggle a GPIO pin around the inference call and measure the pulse with a logic analyzer or oscilloscope.
Convert cycles to time with the actual core clock. As an illustrative example, 4.8 million cycles at 80 MHz is 60 ms, about 16.7 inferences per second; at 160 MHz it’s 30 ms. A latency number without the clock frequency can’t be compared with anything.
Repeat the measurement. MLPerf Tiny runs inference for at least 10 seconds and at least 10 iterations per run, does five runs and reports the median throughput. Caches, flash wait states and interrupts make single measurements unreliable.
Decide and state whether the latency includes feature extraction. MLPerf Tiny excludes preprocessing from its measurement window, and its authors point out that this can distort results when feature extraction is effectively part of the model. For a product demo, the number the user experiences includes it, so measure both and report both.
Step 4: Measure memory from the build and the runtime
Flash: read the size of code plus model weights from the linker map file, not the model file alone; the runtime and kernels take space too. RAM: add the sample buffers, feature buffers and the runtime’s tensor arena. The TensorFlow Lite Micro paper describes its arena-based memory planning, designed for systems without dynamic allocation; use the runtime’s own reporting, or fill the arena with a known pattern and check how much was overwritten, to find the real peak instead of the allocated size.
Step 5: Measure energy per inference on the core supply
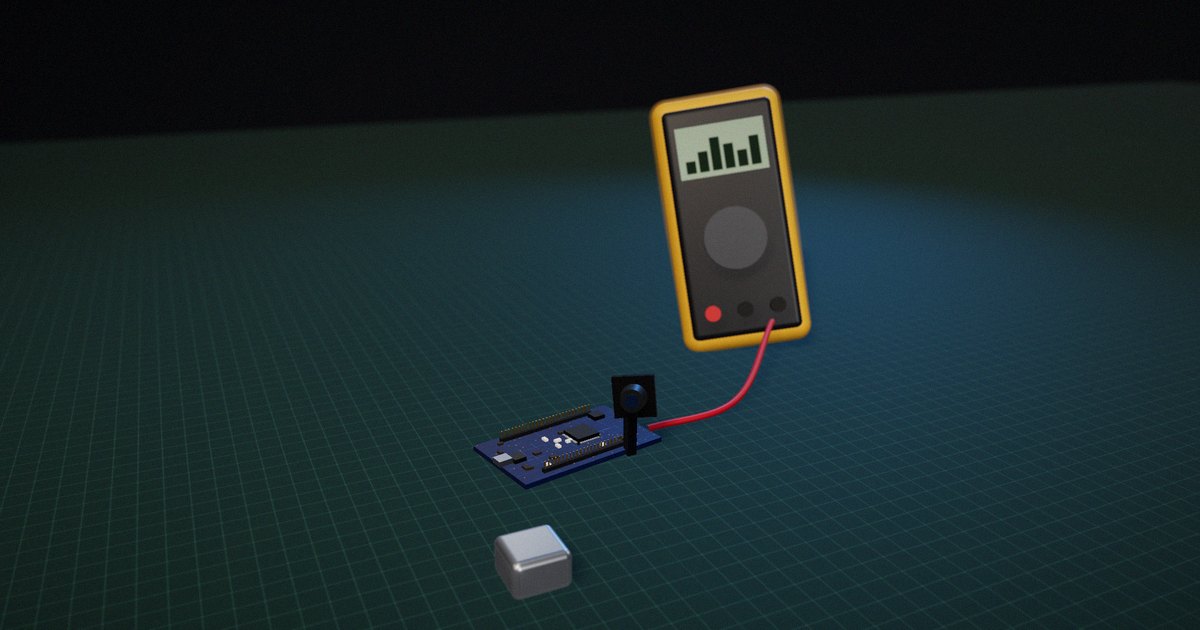
Energy needs a power monitor that measures current at a high enough rate to capture the inference burst, and a way to mark the start and end of the window. MLPerf Tiny’s energy setup is a useful model: a separate energy monitor supplies and measures only the power delivered to the device’s core, a level-shifting IO manager isolates the device from the host so the host’s connections don’t add or leak current, and the device marks the timing window with a GPIO edge. The result is reported in microjoules per inference.
An illustrative calculation: a core drawing 12 mA at 3.0 V for a 60 ms inference uses 3.0 × 0.012 × 0.060 = 2.16 mJ, or 2,160 µJ per inference. Integrate the measured current over the window rather than multiplying a single reading by time; inference current isn’t flat.
Then measure the real duty cycle too: average power over many cycles, including sleep, wake-up and sensor acquisition. Energy per inference tells you about the model; average power tells you about battery life.
Step 6: Report the result with its conditions
Report accuracy, latency, memory and energy together, with the hardware, core clock, compiler and optimization level, runtime and version, model version, whether preprocessing is included and how energy was measured. MLPerf Tiny separates a closed division (same model and data as the reference, quantization allowed) from an open one (model changes allowed, documented); say which kind of comparison your numbers support.
Embedded AI measurements compared
| Metric | How to measure | Common mistake | Report with |
|---|---|---|---|
| Accuracy | Test set streamed through the device pipeline | Using notebook or float-model accuracy | Dataset, quality target, quantized vs float |
| Latency | DWT cycle counter or GPIO pulse, repeated runs, median | Single run; no clock frequency; preprocessing omitted silently | Core clock, compiler flags, with/without features |
| Flash | Linker map: code + runtime + weights | Counting only the model file | Runtime and version |
| RAM | Buffers + feature memory + measured arena peak | Allocated arena size instead of peak; forgetting buffers | Window size, overlap |
| Energy per inference | Power monitor on core supply, GPIO-triggered window, integrated | Datasheet active current × latency; host power leaking in | Supply voltage, what is included |
| Average power | Monitor over many full duty cycles | Measuring with inference running continuously | Duty cycle, sleep mode |
How to put it to work
If you have an hour
Add a GPIO toggle around your inference call and measure it on a scope at the clock frequency you ship. Repeat 10 times and note the median and the spread.
If you have a sprint
Stream your test set through the device, compute on-device accuracy, read flash and RAM from the build and runtime, and measure energy per inference with a power monitor on the core supply. Put the four numbers and their conditions in one table.
If you want it to last the product’s lifetime
Automate the measurement as a hardware-in-the-loop test that runs on every model or firmware release, and fail the build when accuracy drops below the target or latency, memory or energy exceed their budgets.
The question to ask yourself: “Do my accuracy, latency, memory and energy numbers all come from the same build on the same board, and could someone else reproduce them from what I wrote down?”
Frequently asked questions
How do you measure inference latency on a microcontroller?
Read a hardware cycle counter (such as the DWT CYCCNT on Armv7-M Cortex-M cores) before and after inference, or toggle a GPIO pin around the call and measure the pulse with a logic analyzer. Repeat many times, report the median and state the core clock frequency.
How do you measure the energy of an embedded AI inference?
Power the device’s core from a power monitor that samples current fast enough to capture the inference burst, mark the inference window with a GPIO edge and integrate power over the window. Report microjoules per inference, and measure average power over the full duty cycle separately.
Should latency include feature extraction?
For a product, usually yes, because the user experiences the whole pipeline. MLPerf Tiny excludes preprocessing so that models can be compared, and its authors note this can distort results, so report both numbers and say which is which.
Why does my on-device accuracy differ from training?
The usual causes are features computed differently on the device, accuracy lost in int8 quantization and differences between training data and real sensor data. Streaming the test set through the device pipeline isolates the first two.
What is MLPerf Tiny?
MLPerf Tiny is an industry benchmark suite for tiny machine learning systems, developed by more than 50 organizations. It defines four tasks (keyword spotting, visual wake words, image classification and anomaly detection), reference models and quality targets, and measures accuracy, latency and energy under common rules.
Related reading: from sensor input to embedded inference, running inference on a Cortex-M and measuring microcontroller power consumption.
Sources
- Banbury, C., Reddi, V. J., Torelli, P., Holleman, J., et al. (2021). “MLPerf Tiny Benchmark.” Proceedings of the Neural Information Processing Systems Track on Datasets and Benchmarks. arXiv:2106.07597. https://arxiv.org/abs/2106.07597
- Banbury, C. R., Reddi, V. J., Lam, M., Fu, W., et al. (2020). “Benchmarking TinyML Systems: Challenges and Direction.” arXiv:2003.04821. https://arxiv.org/abs/2003.04821
- David, R., Duke, J., Jain, A., Reddi, V. J., et al. (2021). “TensorFlow Lite Micro: Embedded Machine Learning on TinyML Systems.” Proceedings of Machine Learning and Systems (MLSys). arXiv:2010.08678. https://arxiv.org/abs/2010.08678
- Arm Ltd. Armv7-M Architecture Reference Manual (DDI 0403), Data Watchpoint and Trace unit, cycle counter. https://developer.arm.com/documentation/ddi0403/latest/
- Zhang, Y., Suda, N., Lai, L., & Chandra, V. (2017). “Hello Edge: Keyword Spotting on Microcontrollers.” arXiv:1711.07128. https://arxiv.org/abs/1711.07128